Denial Management in Medical Billing Explained for Practice Administrators
Denial management requires three simultaneous workflows, not one after-the-fact task.

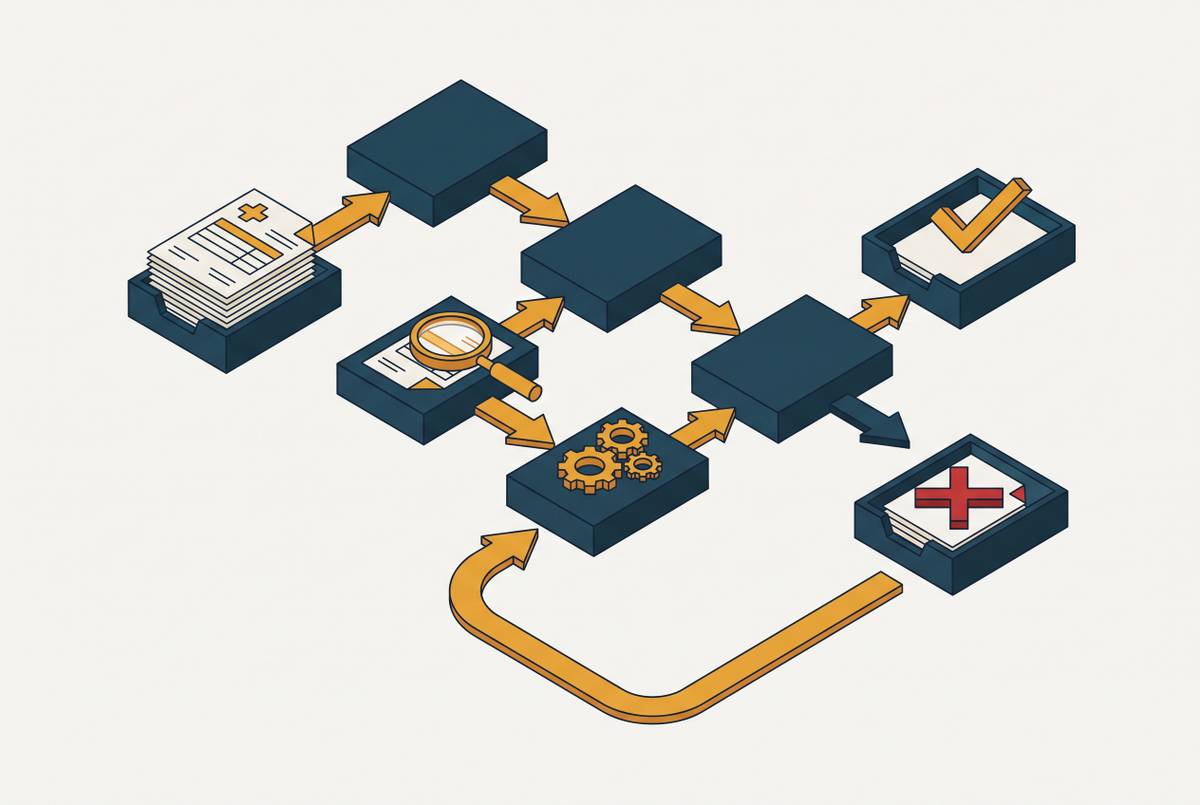
Denial management in medical billing is not one job. It's three: stopping bad claims before they go out, catching denials the moment payers issue them, and running a disciplined appeal process for the ones that slip through anyway. Practice administrators who treat it as a single after-the-fact task, usually assigned to whoever has time at month-end, are the ones watching revenue quietly disappear. The forces driving denials in 2026 are structural, not a symptom of sloppier billing staff, and the practices that hold onto their revenue are the ones that understand this and build a workflow around all three stages at once.
Experian Health's 2025 State of Claims survey, which polled 250 revenue cycle leaders, found that 41% of providers now face denial rates of 10% or higher. That's up from 38% in 2024 and 30% in 2022, a climb that has held steady across every year the survey has run. MD Revenue Group separately put the national average initial denial rate at 11.8% in 2025. PhRMA has tracked initial claim rejection rates climbing 13 percentage points between 2021 and 2025. And Kodiak's State of the Healthcare Revenue Cycle report found net revenue leakage grew 25% year over year, from $38.6 billion in 2024 to $48.4 billion in 2025. Leakage is growing faster than denial volume itself, which means the cost of resolving each denial is rising, not just the number of denials.
That revenue loss doesn't spread evenly. Kodiak's 2025 data shows commercial outpatient claims carrying 10.3% net revenue leakage against 6.6% for inpatient, largely because outpatient claims carry lower dollar values per claim and get worked less aggressively. The Kodiak and related Enjoin figures come from hospital and health-system populations, not physician practices, so they should be read as directional context rather than a direct benchmark for a private practice's own denial rate.
Three structural forces driving the 2026 denial environment
Three separate mechanisms are pushing denial rates upward at once, and none of them originate in a practice's billing office.
The first is CMS's Interoperability and Prior Authorization Final Rule, now in effect for 2026. Payers must give specific reasons for prior authorization denials and meet fixed decision timeframes, seven calendar days for standard requests and 72 hours for expedited ones. What the rule doesn't require is field-level matching between the claim and the authorization on file. A claim that matches the authorization in nine fields out of ten still gets denied on the tenth. The rule adds transparency to the denial reason without closing the gap that produces the denial in the first place.
The second is the edit-table churn coming out of CMS itself. Procedure-to-procedure edits have been updated in 2026, and commercial payers have stacked their own proprietary logic on top of that federal baseline. Claim scrubbers still running last year's edit tables aren't catching anything, they're just waving claims through into payer-side denials that a current scrubber would have flagged before submission.
The third, and probably the least visible from inside a practice, is AI-assisted adjudication on the payer side. Payers now run submitted claims through automated engines that check modifier pairing, diagnosis-to-procedure consistency, prior authorization matching, and eligibility status in seconds, not days. Discrepancies that used to slip past a human reviewer now get caught and denied automatically, at the moment of submission. Physician surveys have found widespread concern that AI is worsening prior authorization denial trends. That's a perception finding, not evidence that AI-reviewed decisions deny at a measurably higher rate than manual review, but it tells you something about how the shift feels from the provider side.
Layer shrinking appeal windows on top of all three, and the mismatch becomes the real story. UnitedHealthcare's provider portal, as of mid-2026, lists a peer-to-peer review window of 3 business days for inpatient cases and 21 calendar days for outpatient cases from the date the denial posts. Some Medicare Advantage plans have tightened their expedited appeal windows for urgent prior auth requests. Some payers have similarly narrowed standard appeal windows for non-urgent PA denials in recent years. A practice running its denial review weekly, or worse, biweekly, is missing windows measured in single-digit days before the claim even lands on someone's desk. That timing gap, not the error rate in the billing department, is the real engine behind the leakage.
How denial rates vary by payer type and what that means for a practice's payer mix
Denial rates aren't uniform across payers, and the gaps are wide enough to change how an administrator should think about growth strategy.
Traditional Medicare is a 4 to 6% denial rate, the most predictable payer in the system. Medicare Advantage runs over 17%, more than double traditional Medicare, and rose 4.8% year over year. Commercial payers are between 10 and 16% depending on the carrier, with UnitedHealthcare topping MGMA's survey categories at roughly 15.6%. UHC's Medicare Advantage prior authorization denial rate specifically, at 12.8%, is the highest among the major MA insurers.
The ACA marketplace looks worse still. Insurers denied 19.1% of in-network claims in Plan Year 2024, about 8.8 million rejected claims out of 46 million submitted across HealthCare.gov states. Among the major national insurers in that population, Oscar Health denied 25.3% and Molina Healthcare denied 22%. Molina's ACA footprint has shifted since that data was collected, so that 22% figure should be read as a snapshot of 2024, not a live number.
Kodiak's March 2026 hospital-level data shows that commercial claims carry a 21% initial denial rate but only a 3% final denial rate, and Medicaid runs 44% initial against 6% final. The gap between initial and final tells you most of these denials are administrative snags, not genuine disagreements over coverage, but working through that gap still costs money and staff time regardless of the outcome. Medicaid's numbers deserve a caveat of their own: the program has been subject to ongoing policy changes through 2026, so historical Medicaid denial patterns may not hold steady.
For an administrator, the practical takeaway is arithmetic, not diagnosis. If a practice's payer mix is drifting toward Medicare Advantage and commercial plans, which is happening across most specialties, the blended denial rate climbs even if nothing changes in the billing office. Payer mix analysis has to come before anyone sets a denial reduction target, or the target will be measuring the wrong thing. Prior authorization exposure by specialty tracks a similar pattern: prior authorization requirements have continued to expand across a range of service categories, including imaging, specialty drugs, outpatient surgery, and behavioral health. Orthopedics, neurology, oncology, rheumatology, dermatology, and gastroenterology carry the heaviest PA-driven denial load as a result.
The five root causes that account for the large majority of denials
Industry data puts roughly 75% of all denials inside just five CARC categories. That concentration is the single most useful fact in this entire discipline, because it means a practice doesn't need to fix everything at once. Fixing five categories moves the blended denial rate more than almost any other intervention available.
Experian Health's 2025 survey backs this up from the provider side: 50% of respondents named missing or inaccurate claim data as the top denial driver, 35% cited authorization issues, and 32% pointed to registration data errors. Separately, roughly 77% of denials trace to administrative causes, eligibility, demographics, missing authorizations, rather than clinical necessity disputes. Most of the revenue a practice loses to denials isn't lost on hard medical necessity arguments. It's lost on front-end paperwork that should never have gone out the door wrong.
The five categories, and what actually prevents each one:
Eligibility and coverage issues get caught with real-time verification, done at scheduling and again at check-in. Coverage lapses and plan switches happen between those two points more often than most billing teams assume, which is exactly why a single check at scheduling isn't enough.
Missing or inaccurate claim data gets caught by scrubbing against payer-specific rules. A scrubber running outdated logic passes errors straight through as if they weren't there.
Missing or mismatched prior authorization needs tracking that's tied directly to claim submission. Payer PA requirement lists expanded substantially between 2024 and 2026, so a list that was current last year is already stale.
Coding errors, including modifier mismatches and bundling conflicts, are increasingly a timing problem as much as a knowledge problem. NCCI edits updated mid-cycle in 2026 mean a scrubber that only refreshes quarterly is structurally behind the payer's own logic.
Timely filing violations are the cheapest to prevent and the most permanent once missed. Daily submission discipline is the only fix, because once the filing window closes, there's no appeal path left. The revenue is simply gone.
Cost matters here too. Reworking a single denied claim runs between $25 and $181 depending on complexity. The low end covers a simple eligibility fix; the high end covers a clinical necessity dispute with documentation attached. Fixing the administrative causes on the front end doesn't just prevent the denial, it eliminates the expensive rework entirely, which is a different and larger win than it sounds like on paper.
Pre-submission prevention: what a functioning front-end workflow includes
A front-end workflow that actually works has four moving parts, and skipping any one of them reopens the gap the other three are trying to close.
Real-time eligibility verification has to happen twice: at scheduling, and again at check-in. CMS consistently names eligibility and coverage issues as a leading driver of improper payments, and the reason a single check isn't enough is simple. Coverage changes in the days between scheduling a visit and showing up for it, and a scheduling-only check has no way to catch that.
Prior authorization tracking means checking against a current, payer-specific list every time, not relying on what worked last quarter. The authorization on file has to match the submitted claim at the field level: exact CPT code, exact modifier, exact site of service. Under the CMS Interoperability rule now in effect, a mismatch on any one of those fields can trigger an automatic denial, regardless of how minor the discrepancy looks to a human reviewer.
Claim scrubbing needs to run against edit tables that reflect the mid-cycle NCCI changes, which is not how most billing services currently operate since they refresh their static rule sets quarterly at best. That gap between "current" and "quarterly" is exactly what's producing CO-97 bundling denials on claims that would have cleared fine under last year's logic.
Clean claim rate is the metric that tells an administrator whether any of this is actually working. A clean claim rate that is slipping is a signal that needs attention immediately, not at the next quarterly review. A clean claim rate that's slipping is the earliest possible warning sign, arriving well before the denial itself does.
Gold carding doesn't exempt a practice from this discipline. Even physicians with very high historical approval rates on certain services are still submitting full PA requests that get run through the same AI-assisted review and denied at similar rates. Gold carding legislation exists in Texas, Virginia, and Georgia, but enforcement against Medicare Advantage plans specifically remains limited. Treating a strong approval history as a pass on PA workflow discipline is a mistake that becomes visible in the denial numbers a few months later.
Real-time denial identification: why speed of detection is what determines recoverability
Speed is the whole game at this stage, and the numbers make clear why. UHC's peer-to-peer review window is narrow and measured in days from the denial date. Some MA plans impose expedited appeal windows as short as 48 hours for urgent PA cases. Some payers allow only a short window for standard PA appeals. A practice that reviews denials weekly, let alone biweekly, is structurally incapable of meeting some of these deadlines, no matter how skilled the appeals staff are once they finally see the claim.
The consequence appears in a number that should alarm any administrator who hasn't seen it before: roughly 65% of denied claims are never reworked at all, according to MGMA data. That's not because the appeals are unwinnable. It's because by the time the denial appears in a batch review, the window has already closed, or the claim has aged past the point of being worth the rework cost.
Fixing this means moving off month-end reconciliation and into real-time payment posting and accounts receivable monitoring. A siloed system that only reveals denials at month-end has already burned most or all of the recovery window before anyone on staff even knows the denial exists. Denials also need to be tagged the moment they're received, by root cause, whether that's eligibility, authorization, bundling, timely filing, or medical necessity, so the right response starts immediately instead of sitting in a queue waiting for someone to triage it.
Prior authorization denials deserve particular attention here. Across 240 specialty practices analyzed in MBC's denial management study, prior auth denials now account for 34% of all first-pass claim denials, up from 22% in 2023. That's a fast-moving share of the denial pie, and it requires same-day identification just to have a shot at the shortened peer-to-peer windows now standard across major payers.
Days in accounts receivable is the metric that ties all of this together. HFMA sets the standard target between 30 and 40 days, with high performers staying under 30. Anything past 50 days signals a cash flow problem serious enough to warrant immediate attention. AR aging doesn't cause slow identification of denials, but it's the clearest lagging indicator that slow identification is already costing the practice its recovery window.
Working a denial: how the appeal and resubmission process is structured by denial type
Appeals work when the documentation behind them is complete. Success rates on appeals with full supporting documentation run between 40% and 70% or higher, and among denied Medicare Advantage claims specifically, 57% were ultimately overturned on appeal. The revenue is genuinely recoverable in a majority of cases. It's only lost permanently when nobody files, or files without the right documentation attached.
Administrative denials, eligibility issues, missing information, timely filing, are the fastest category to close. Correct the data error, resubmit, done. If real-time identification is working the way it should, these should almost never reach a formal appeal in the first place, and most of them fall toward the cheap end of that $25 to $181 rework range.
Authorization mismatches need the authorization record matched to the claim before anything gets resubmitted. If the authorization existed but one claim field didn't match exactly, correction and resubmission is the path forward. If the authorization was never obtained at all, a retro-authorization request is sometimes an option, but it's payer-specific and time-limited, so it can't be treated as a reliable fallback.
Clinical necessity denials take more work and more precision. Payer NLP systems are now comparing clinical notes directly against CPT and ICD-10 codes before a human ever reviews the file, which means vague medical necessity language that used to pass a human reviewer now triggers an automatic denial before it reaches one. Appeal letters need to speak directly to the specific policy language the payer cited in the denial.
Peer-to-peer reviews have to be tracked by denial date, not by whenever the batch review happens to run, since windows as tight as UHC's 14 days leave no margin for administrative delay.
CO-97 bundling denials split into two groups that appeals staff need to tell apart before spending time on either. Roughly 30% of NCCI procedure-pair edits carry a modifier indicator meaning no modifier can override the bundle, full stop, according to CMS's own NCCI data. Those are coding-selection problems, not appeal opportunities, and appealing them wastes staff time on something unwinnable. The remaining edits may be bypassable with the correct modifier if documentation supports a genuinely distinct service, and those are worth the appeal.
Every practice also needs a written escalation and write-off threshold. Below a certain dollar amount, the $25 to $181 rework cost simply isn't worth spending against the claim's value, and pretending otherwise burns staff hours that should go toward the high-value clinical necessity denials that actually warrant a full documentation-driven appeal.
The metrics that tell administrators whether their denial management is working
Clean claim rate comes first, because it's the leading indicator, the one that measures prevention before a denial ever happens. Target 98% or above; anything below 90% is a structural problem, not a rough week.
First-pass denial rate comes next. HFMA's acceptable band runs 5 to 10%, though the published industry average is currently 9 to 12%, so a large share of practices are running above what HFMA considers acceptable. Watching this number month over month tells an administrator whether the front-end fixes described earlier are actually taking hold, or whether the practice is still absorbing avoidable denials at the same rate it always has.
Together, clean claim rate, first-pass denial rate, days in AR, and the percentage of denials worked within their appeal window form the real dashboard. None of them is sufficient alone. A practice can have a strong clean claim rate and still bleed revenue if its AR aging is high, because that's a sign denials are sitting unworked past their recovery window. The discipline isn't in tracking one number well. It's in tracking all of them together, catching the gap between prevention and recovery before it turns into revenue that's gone for good.
Sources
- Medical Billing Denial Statistics 2026: Industry Data & Benchmarks
- Prior Auth Denial Trends 2026
- Hospital Denial Rates: Benchmarks, Trends & What the Data Shows (2026) | Enjoin
- Medical Billing Denial Management: Recover Every Dollar in 2026
- Four in Ten Practices Now See Denials Above 10 Percent
- 2026 Denial-Rate Benchmark by Specialty | Medi Docs
- 50+ US Healthcare Denial Rates & Reimbursement Statistics for 2026
- ACA Health Insurance Claim Denials: 2026 State & Insurer Rankings